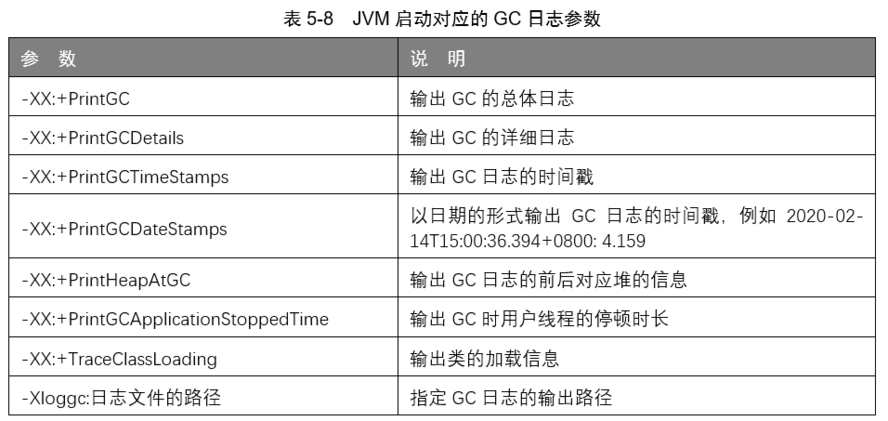
Java 应用程序的 GC 日志对分析定位很多性能问题有着非常大的帮助。默认情况下, Java 应用程序不会自动产生 GC 日志。如果需要输出 GC 日志,必须在 JVM 启动时增加对应的参数,场景的参数如表 5-8 所示。
1. GC 日志分析一
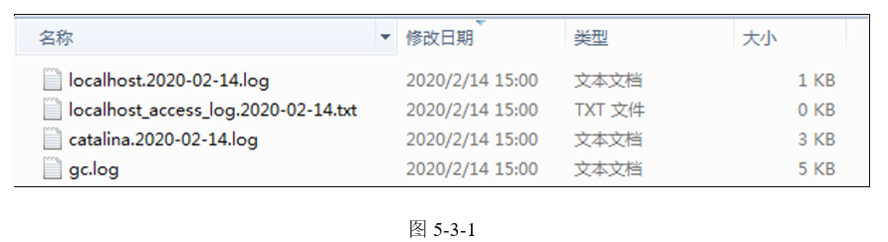
例如 , 在 Tomcat 的 JVM 启动参数中加入参数: -XX:+PrintGC -XX:+PrintGCDetails -XX:+PrintGCDateStamps -XX:+PrintHeapAtGC -Xloggc:..\logs\gc.log ,在 Tomcat 运行后即可在 logs 目录下生成对应的 GC 日志, 如图 5-3-1 所示。
输出的 GC日志内容如下:
Java HotSpot(TM) 64-Bit Server VM (25.101-b13) for windows-amd64 JRE (1.8.0_101-b13), built on Jun 22 2016 01:21:29 by "java_re" with MS VC++ 10.0 (VS2010)
Memory: 4k page, physical 8078128k(2694664k free), swap 16154412k(4180772k free)
CommandLine flags: -XX:InitialHeapSize=129250048 -XX:+ManagementServer -XX:MaxHeapSize=2068000768 -XX:+PrintGC -XX:+PrintGCDateStamps -XX:+PrintGCDetails -XX:+PrintGCTimeStamps -XX:+PrintHeapAtGC -XX:+UseCompressedClassPointers -XX:+UseCompressedOops -XX:-UseLargePagesIndividualAllocation -XX:+UseParallelGC
{Heap before GC invocations=1 (full 0):
 PSYoungGen      total 36864K, used 31744K [0x00000000d6e00000, 0x00000000d9700000, 0x0000000100000000)
  eden space 31744K, 100% used [0x00000000d6e00000,0x00000000d8d00000,0x00000000d8d00000)
  from space 5120K, 0% used [0x00000000d9200000,0x00000000d9200000,0x00000000d9700000)
  to   space 5120K, 0% used [0x00000000d8d00000,0x00000000d8d00000,0x00000000d9200000)
 ParOldGen       total 84992K, used 0K [0x0000000084a00000, 0x0000000089d00000, 0x00000000d6e00000)
  object space 84992K, 0% used [0x0000000084a00000,0x0000000084a00000,0x0000000089d00000)
 Metaspace       used 13952K, capacity 14326K, committed 14592K, reserved 1062912K
  class space    used 1560K, capacity 1705K, committed 1792K, reserved 1048576K
2020-02-14T15:34:30.245+0800: 1.292: [GC (Allocation Failure) [PSYoungGen: 31744K->5104K(36864K)] 31744K->7267K(121856K), 0.0131568 secs] [Times: user=0.03 sys=0.01, real=0.01 secs]
Heap after GC invocations=1 (full 0):
 PSYoungGen      total 36864K, used 5104K [0x00000000d6e00000, 0x00000000d9700000, 0x0000000100000000)
  eden space 31744K, 0% used [0x00000000d6e00000,0x00000000d6e00000,0x00000000d8d00000)
  from space 5120K, 99% used
[0x00000000d8d00000,0x00000000d91fc040,0x00000000d9200000)
  to   space 5120K, 0% used [0x00000000d9200000,0x00000000d9200000,0x00000000d9700000)
 ParOldGen       total 84992K, used 2163K [0x0000000084a00000, 0x0000000089d00000, 0x00000000d6e00000)
  object space 84992K, 2% used [0x0000000084a00000,0x0000000084c1ce70,0x0000000089d00000)
 Metaspace       used 13952K, capacity 14326K, committed 14592K, reserved 1062912K
  class space    used 1560K, capacity 1705K, committed 1792K, reserved 1048576K
}

……

{Heap before GC invocations=8 (full 0):
 PSYoungGen      total 144896K, used 88289K [0x00000000d6e00000, 0x00000000e9700000, 0x0000000100000000)
  eden space 125440K, 54% used [0x00000000d6e00000,0x00000000db13e380,0x00000000de880000)
  from space 19456K, 99% used [0x00000000de880000,0x00000000dfb7a2b0,0x00000000dfb80000)
  to   space 26624K, 0% used [0x00000000e7d00000,0x00000000e7d00000,0x00000000e9700000)
 ParOldGen       total 84992K, used 39157K [0x0000000084a00000, 0x0000000089d00000, 0x00000000d6e00000)
  object space 84992K, 46% used [0x0000000084a00000,0x000000008703d6c8,0x0000000089d00000)
 Metaspace       used 20699K, capacity 21010K, committed 21248K, reserved 1069056K
  class space    used 2353K, capacity 2457K, committed 2560K, reserved 1048576K
2020-02-14T15:34:35.879+0800: 6.926: [GC (Metadata GC Threshold) [PSYoungGen: 88289K->14355K(274432K)] 127447K->53769K(359424K), 0.1285266 secs] [Times: user=0.48 sys=0.02, real=0.13 secs]
Heap after GC invocations=8 (full 0):
 PSYoungGen      total 274432K, used 14355K [0x00000000d6e00000, 0x00000000e9400000, 0x0000000100000000)
  eden space 250880K, 0% used [0x00000000d6e00000,0x00000000d6e00000,0x00000000e6300000)
  from space 23552K, 60% used [0x00000000e7d00000,0x00000000e8b04f28,0x00000000e9400000)
  to   space 25088K, 0% used [0x00000000e6300000,0x00000000e6300000,0x00000000e7b80000)
 ParOldGen       total 84992K, used 39413K [0x0000000084a00000, 0x0000000089d00000, 0x00000000d6e00000)
  object space 84992K, 46% used [0x0000000084a00000,0x000000008707d6d8,0x0000000089d00000)
 Metaspace       used 20699K, capacity 21010K, committed 21248K, reserved
 1069056K
  class space    used 2353K, capacity 2457K, committed 2560K, reserved 1048576K
}
{Heap before GC invocations=9 (full 1):
 PSYoungGen      total 274432K, used 14355K [0x00000000d6e00000, 0x00000000e9400000, 0x0000000100000000)
  eden space 250880K, 0% used [0x00000000d6e00000,0x00000000d6e00000,0x00000000e6300000)
  from space 23552K, 60% used [0x00000000e7d00000,0x00000000e8b04f28,0x00000000e9400000)
  to   space 25088K, 0% used [0x00000000e6300000,0x00000000e6300000,0x00000000e7b80000)
 ParOldGen       total 84992K, used 39413K [0x0000000084a00000, 0x0000000089d00000, 0x00000000d6e00000)
  object space 84992K, 46% used [0x0000000084a00000,0x000000008707d6d8,0x0000000089d00000)
 Metaspace       used 20699K, capacity 21010K, committed 21248K, reserved 1069056K
  class space    used 2353K, capacity 2457K, committed 2560K, reserved 1048576K
2020-02-14T15:34:36.007+0800: 7.054: [Full GC (Metadata GC Threshold) [PSYoungGen: 14355K->0K(274432K)] [ParOldGen: 39413K->32862K(83456K)] 53769K->32862K(357888K), [Metaspace: 20699K->20699K(1069056K)], 0.1843152 secs] [Times: user=0.62 sys=0.00, real=0.18 secs]
Heap after GC invocations=9 (full 1):
 PSYoungGen      total 274432K, used 0K [0x00000000d6e00000, 0x00000000e9400000, 0x0000000100000000)
  eden space 250880K, 0% used [0x00000000d6e00000,0x00000000d6e00000,0x00000000e6300000)
  from space 23552K, 0% used [0x00000000e7d00000,0x00000000e7d00000,0x00000000e9400000)
  to   space 25088K, 0% used [0x00000000e6300000,0x00000000e6300000,0x00000000e7b80000)
 ParOldGen       total 83456K, used 32862K [0x0000000084a00000, 0x0000000089b80000, 0x00000000d6e00000)
  object space 83456K, 39% used [0x0000000084a00000,0x0000000086a17ba0,0x0000000089b80000)
 Metaspace       used 20699K, capacity 21010K, committed 21248K, reserved 1069056K
  class space    used 2353K, capacity 2457K, committed 2560K, reserved 1048576K
}
从日志中可以看到年轻代的垃圾回收和年老代的垃圾回收情况,并且在垃圾回收执行的前后都输出了堆内存的使用情况。
( 1 ) “Java HotSpot(TM) 64-Bit Server VM (25.101-b13) for windows-amd64 JRE (1.8.0_101-b13), built on Jun 22 2016 01:21:29 by "java_re" with MS VC++ 10.0 (VS2010)” 这一段输出了 JVM 虚拟机的版本以及当前 JVM 的运行环境。
( 2 ) “Memory: 4k page, physical 8078128k(2694664k free), swap 16154412k(4180772k free)” 这一段输出了操作系统的物理内存和虚拟内存的总量以及使用情况。
(
3
)
“CommandLine flags: -XX:InitialHeapSize=129250048 -XX:+ManagementServer -XX:Max
HeapSize=2068000768 -XX:+PrintGC -XX:+PrintGCDateStamps -XX:+PrintGCDetails -XX:
+PrintGCTimeStamps -XX:+PrintHeapAtGC -XX:+UseCompressedClassPointers -XX:+
UseCompressedOops -XX:-UseLargePagesIndividualAllocation -XX:+UseParallelGC”
这一段输出了
JVM
的
GC
垃圾回收器信息以及
GC
日志的打印参数。
2. GC 日志分析二
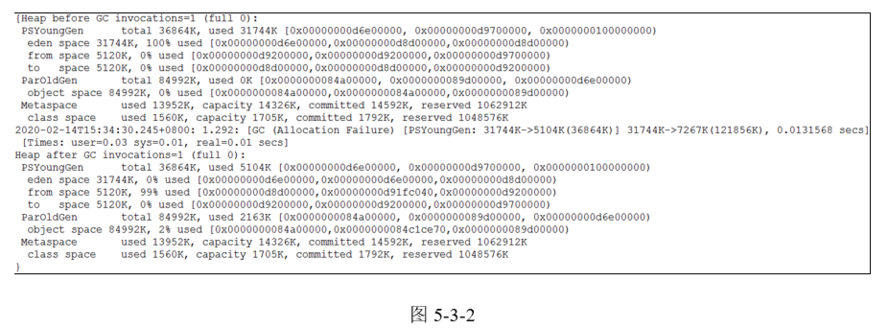
如图 5-3-2 所示是 JVM 中一次年轻代内存区域 GC 垃圾回收的输出日志,一次完整的 GC 日志一般被一个 “{}” 所包括。
( 1 ) “Heap before GC invocations=1 (full 0)” 描述了发生了一次 GC 垃圾回收, “full 0” 表示发生了 0 次 Full GC ,在之后描述了发生 GC 垃圾回收之前和之后年轻代区域( PSYoungGen )、 eden 区域( eden space )、 From Survivor 空间区域( from space )、 To Survivor 空间区域( to space )、年老代区域( ParOldGen )、元数据区域( Metaspace )、 class space 的内存空间使用情况。
( 2 ) “2020-02-14T15:34:30.245+0800: 1.292: [GC (Allocation Failure) [PSYoungGen: 31744K->5104K(36864K)] 31744K->7267K(121856K), 0.0131568 secs] [Times: user=0.03 sys=0.01, real=0.01 secs]” 描述了在 2020-02-14T15:34:30.245 这个时间发生了一次年轻代 GC 垃圾回收、 GC 发生原因是 Allocation Failure (年轻代中没有足够的空间能够存储新的数据了)、 GC 发生时年轻代内存使用从 31744KB 减少为 5104KB ( [PSYoungGen: 31744K->5104K(36864K)] )、 GC 发生时堆内存的总使用从 31744KB 减少为 7267KB ( 31744K->7267K(121856K) )、 GC 总耗时时长为 0.0131568 秒、用户耗时 0.03 秒、系统耗时 0.01 秒、实际耗时 0.01 秒。
本文节选自《软件性能测试、分析与调优实践之路(第2版)》,获作者和出版社授权发布。