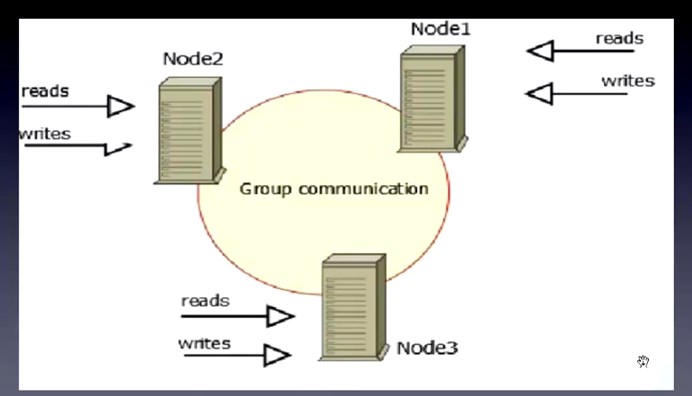
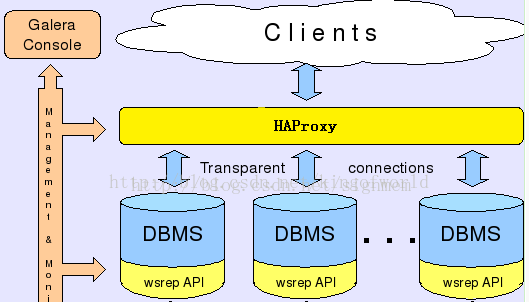
最近,本人根据度娘,学习了mysql的一种高可用和负载均衡方案——percona xtradb cluster(简称pxc),这是一种同步的复制方案,每个节点都可以读写,并且写一份数据,其他节点会同时拥有。在 XtraDB Cluster 中,没有主从的概念。
缺点及限制:
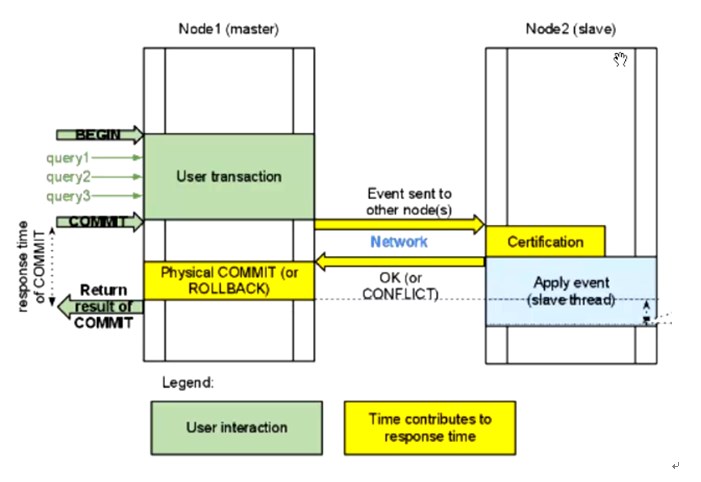
由于同一个事务需要在集群的多台机器上执行,因此网络传输及并发执行会导致性能上有一定的消耗。所有机器上都存储着相同的数据,全冗余。若一台机器既作为主服务器,又作为备份服务器,出现乐观锁导致rollback的概率会增大,编写程序时要小心。不支持的SQL:LOCK / UNLOCK TABLES / GET_LOCK(), RELEASE_LOCK()…不支持XA Transaction目前基于Galera Cluster的实现方案有三种:Galera Cluster for MySQL、Percona XtraDB Cluster、MariaDB Galera Cluster。
我们采用较成熟、应用案例较多的Percona XtraDB Cluster。
下面就一起来安装体验一下吧。
机器:分配
db_01:10.72.16.116:3306、 db_02:10.72.16.117:3306、db_03:10.72.16.118:3307
haproxy:10.72.16.118:3306
一、安装包准备
wget http://apt.sw.be/redhat/el6/en/x86_64/rpmforge/RPMS/socat-1.7.2.4-1.el6.rf.x86_64.rpm
wget http://mirror.centos.org/centos/6/os/x86_64/Packages/nc-1.84-22.el6.x86_64.rpm
二、删除原有软件包
不删除会冲突,安装不上。
rpm -qa | grep -i mysql | xargs sudo rpm -e --nodeps
三、安装
1、安装percona-xtrabackup
yum -y install perl-DBD-MySQL
yum -y install perl-Time-HiRes
rpm -ivh percona-xtrabackup-2.2.12-1.el6.x86_64.rpm
2、安装Percona-XtraDB-Cluster-galera
rpm -ivh Percona-XtraDB-Cluster-galera-2-2.12-1.2682.rhel6.x86_64.rpm
rpm -ivh Percona-XtraDB-Cluster-galera-2-debuginfo-2.12-1.2682.rhel6.x86_64.rpm
3、安装Percona-XtraDB-Cluster-client
[root@localhost soft]# rpm -ivh Percona-XtraDB-Cluster-client-55-5.5.41-25.11.853.el6.x86_64.rpm
4、安装Percona-XtraDB-Cluster-server
[root@localhost soft]# rpm -ivh socat-1.7.2.4-1.el6.rf.x86_64.rpm
warning: socat-1.7.2.4-1.el6.rf.x86_64.rpm: Header V3 DSA/SHA1 Signature, key ID 6b8d79e6: NOKEY
Preparing... ########################################### [100%]
1:socat ########################################### [100%]
[root@localhost soft]# rpm -ivh Percona-XtraDB-Cluster-server-55-5.5.41-25.11.853.el6.x86_64.rpm
warning: Percona-XtraDB-Cluster-server-55-5.5.41-25.11.853.el6.x86_64.rpm: Header V4 DSA/SHA1 Signature, key ID cd2efd2a: NOKEY
Preparing... ########################################### [100%]
1:Percona-XtraDB-Cluster-########################################### [100%]
/var/tmp/rpm-tmp.etTgDS: line 101: x0: command not found
Percona XtraDB Cluster is distributed with several useful UDFs from Percona Toolkit.
Run the following commands to create these functions:
mysql -e "CREATE FUNCTION fnv1a_64 RETURNS INTEGER SONAME 'libfnv1a_udf.so'"
mysql -e "CREATE FUNCTION fnv_64 RETURNS INTEGER SONAME 'libfnv_udf.so'"
mysql -e "CREATE FUNCTION murmur_hash RETURNS INTEGER SONAME 'libmurmur_udf.so'"
See http://www.percona.com/doc/percona-server/5.5/management/udf_percona_toolkit.html for more details
这时候就安装了一个percona的mysql,不是原生的mysql。
四、修改my.cnf
find / -name 'my-default.cnf'
cp my-default.cnf /etc/my.cnf
10.72.16.116 机器的配置:
vi /etc/my.cnf
[mysqld]
#datadir=/var/lib/mysql
datadir=/data/mysql
socket=/var/lib/mysql/mysql.sock
user=mysql
port=3306
#default-storage-engine=INNODB
#skip-grant-table
# Default to using old password format for compatibility with mysql 3.x
# clients (those using the mysqlclient10 compatibility package).
# Disabling symbolic-links is recommended to prevent assorted security risks;
# to do so, uncomment this line:
# symbolic-links=0
#skip-grant-tables
#replicate-do-db=db1
##############第一个节点添加如下部分###############
server_id=116 #修改此项和节点一不同
wsrep_provider=/usr/lib64/libgalera_smm.so
wsrep_cluster_address=gcomm://10.72.16.116,10.72.16.117,10.72.16.118 #Cluster集群中的所有节点IP,不用写端口,非默认端口也不用写
wsrep_node_address = 10.72.16.116 #Cluster集群当前节点的IP
wsrep_sst_auth=sstuser:secret
#wsrep_provider_options="gcache.size = 1G;debug = yes"
wsrep_provider_options="gcache.size=1G"
wsrep_cluster_name=pxc_taotao #Cluster 集群的名字
#wsrep_sst_method=xtrabackup
#wsrep_sst_method = rsync #很大,上T用这个
wsrep_sst_method = xtrabackup-v2 #100-200G用
wsrep_node_name=db_01 #修改此项和节点一不同
wsrep_slave_threads=4
innodb_locks_unsafe_for_binlog=1
innodb_autoinc_lock_mode=2
#wsrep_sst_donor = #从那个节点主机名同步数据
####################
[mysqld_safe]
log-error=/var/log/mysqld.log
pid-file=/var/run/mysqld/mysqld.pid
~~~~~~~~~~~~~~~~~~~
10.72.16.117的/etc/my.cnf
[mysqld]
#datadir=/var/lib/mysql
datadir=/data/mysql
#socket=/var/lib/mysql/mysql.sock
user=mysql
#port=3306
#default-storage-engine=INNODB
#skip-grant-table
# Default to using old password format for compatibility with mysql 3.x
# clients (those using the mysqlclient10 compatibility package).
# Disabling symbolic-links is recommended to prevent assorted security risks;
# to do so, uncomment this line:
# symbolic-links=0
#skip-grant-tables
#replicate-do-db=db1
##############
server_id=117 #修改此项和节点一不同
wsrep_provider=/usr/lib64/libgalera_smm.so
wsrep_cluster_address=gcomm://10.72.16.116,10.72.16.117,10.72.16.118 #Cluster集群中的所有节点IP,不用写端口,非默认端口也不用写
wsrep_node_address = 10.72.16.117 #Cluster集群当前节点的IP
wsrep_sst_auth=sstuser:secret
#wsrep_provider_options="gcache.size = 1G;debug = yes"
wsrep_provider_options="gcache.size=1G"
wsrep_cluster_name=pxc_taotao #Cluster 集群的名字
#wsrep_sst_method=xtrabackup
#wsrep_sst_method = rsync #很大,上T用这个
wsrep_sst_method = xtrabackup-v2 #100-200G用
wsrep_node_name=db_02 #修改此项和节点一不同
wsrep_slave_threads=4
innodb_locks_unsafe_for_binlog=1
innodb_autoinc_lock_mode=2
#wsrep_sst_donor = #从那个节点主机名同步数据
###################
[mysqld_safe]
log-error=/var/log/mysqld.log
pid-file=/var/run/mysqld/mysqld.pid
10.72.16.118的my.cnf
[mysqld]
datadir=/var/lib/mysql
socket=/var/lib/mysql/mysql.sock
user=mysql
port=3307
# Disabling symbolic-links is recommended to prevent assorted security risks
symbolic-links=0
######################添加如下部分###########
server_id=118 #修改此项和节点一不同
wsrep_provider=/usr/lib64/libgalera_smm.so
wsrep_cluster_address=gcomm://10.72.16.116,10.72.16.117,10.72.16.118 #Cluster集群中的所有节点IP,不用写端口,非默认端口也不用写
wsrep_node_address = 10.72.16.118 #Cluster集群当前节点的IP
wsrep_sst_auth=sstuser:secret
#wsrep_provider_options="gcache.size = 1G;debug = yes"
wsrep_provider_options="gcache.size=1G"
wsrep_cluster_name=pxc_taotao #Cluster 集群的名字
#wsrep_sst_method=xtrabackup
#wsrep_sst_method = rsync #很大,上T用这个
wsrep_sst_method = xtrabackup-v2 #100-200G用
wsrep_node_name=db_03 #修改此项和节点一不同
wsrep_slave_threads=4
innodb_locks_unsafe_for_binlog=1
innodb_autoinc_lock_mode=2
#wsrep_sst_donor = #从那个节点主机名同步数据
#############################
[mysqld_safe]
log-error=/var/log/mysqld.log
pid-file=/var/run/mysqld/mysqld.pid
注:第二个节点10.72.16.117和第三个节点10.72.16.118的my.cnf配置文件只需修改如下三个参数即可:
wsrep_node_address 参数为Cluster集群节点的当前机器的IP地址
server-id 的标识
wsrep_node_name=db_03 #修改此项和节点一不同,并非是主机名
五、然后在10.72.16.116机器上(第一个节点)初始化数据库:
# mysql_install_db --user=mysql --basedir=/usr --datadir=/data/mysql
六、启动集群的第一个节点(10.72.16.116)
# service mysql bootstrap-pxc --wsrep-cluster-address="gcomm://"
如果iptables和selinux没有关闭,此处会启动失败。以上述方式启动完第一个节点后,用命令service mysql start依次启动第二和第三个节点。当全部节点启动完毕后,再回过来把第一个节点ervice myslq restart重新启动。这是因为在集群节点全部关闭状态下,第一个启动的节点必须以gcomm://方式启动。
参考:http://itindex.net/detail/47702-percona-xtradb-cluster
七、配置备份用户
第一个节点启动后,在启动第二个节点之前需要配置备份用户,否则第二个节点无法启动。因为第二个节点通过xtrabackup进行拉数据,需要通过配置文件中的sstuser用户。
mysql> Grant all privileges on *.* to 'sstuser'@'%' identified by 'secret' with grant option;
mysql> flush privileges;
验证sstuser是否可以本地登录
# mysql -usstuser -psecret
如果无法登录,增加:
mysql> Grant all privileges on *.* to 'sstuser'@'localhost' identified by 'secret' with grant option;
mysql> flush privileges;
八、其它节点
其它节点无需初始化数据库,只需要service mysql start,数据会通过xbackup从第一个节点上拉过来。
不过,笔者在启动第二个节点10.72.16.117mysql服务报错,查看了本地/var/log/mysqld.log的日志错误,一直不知所云。
最后,笔者在启动第二个节点mysql服务时,去第一个节点10.72.16.116观察日志,发现了如下这样的错误:
WSREP_SST: [ERROR] innobackupex finished with error: 1. Check /data/mysql//innobackup.backup.log (20150926 22:38:20.148)
WSREP_SST: [ERROR] Cleanup after exit with status:22 (20150926 22:38:20.154)
赶紧到第一个节点的/data/mysql//innobackup.backup.log看错误,如下:
ERROR: Failed to connect to MySQL server as DBD::mysql module is not installed at /usr/bin/innobackupex line 1397
查看百度,大多数都是说安装 yum -y install perl-DBD-MySQL就好了,可我明明是安装的呀。最后安装这篇博客的方法试了一下,结果成功了:http://www.eduyo.com/computer/software/1086.html
解决方法是这样的,就是重装一下perl-DBD-MySQL,再第二个节点10.72.16.117重启mysql服务就好了。
具体解决方法:
rpm -qa |grep -i dbd
rpm -qa |grep -i dbi
查找出来后执行:
rpm -e –nodeps perl-DBD-MySQL
rpm -e –nodeps perl-DBI
然后执行:
yum install -y perl-DBD-MySQL 即可
最后我们可以透过MySQL Status来看看是否有建立成功。
mysql> show global status like 'wsrep_cluster_size';
+--------------------+-------+
| Variable_name      | Value |
+--------------------+-------+
| wsrep_cluster_size | 3     |
+--------------------+-------+
1 row in set (0.00 sec)
看到wsrep_cluster_size出现正确的Server数量,就代表设定成功。
九、pxc集群节点启动顺序
当pxc环境搭建好了后,如果将来有一天这个集群里面的三个节点全部宕机了,那么如果启动第一个节点时以service mysql start方式是有问题的。启动第一个节点(任何节点都可以做为第一节点)正确的做法如下:
参考:http://itindex.net/detail/47702-percona-xtradb-cluster
十、haproxy的安装
1、软件下载地址
http://www.haproxy.org/download/1.5/src/haproxy-1.5.14.tar.gz
如果你打不开这个网站,可能得需要翻墙才能下载,我就翻墙才下载的。
tar -xvf haproxy-1.5.14.tar.gz
cd haproxy-1.5.14
make TARGET=linux26 PREFIX=/usr/local/haproxy
make install PREFIX=/usr/local/haproxy
十一、创建haproxy配置文件
haproxy 默认是没有配置文件的,需要自己手机创建
mkdir /usr/local/haproxy/etc
- [root@localhost etc]# cat /usr/local/haproxy/etc/haproxy.cfg
- # this config needs haproxy-1.1.28 or haproxy-1.2.1
- global #全局参数
- log 127.0.0.1 local0 #定义日志输出到哪里,以及日志级别,格式log
[max level [min level]],使用ip地址,默认使用udp 514端口,可以配置两种日志,一种进程启动和退出,一种代理日志 - log 127.0.0.1 local1 notice
- maxconn 4096 #每个进程的最大并发连接数
- #ulimit-n 10240 #每个进程的文件描述符,默认根据maxconn值自动计算
- # chroot /usr/share/haproxy #安全目录,需要root权限启动haproxy
- uid 99 #进程的用户ID,必须使用root用户运行,交换到指定的用户,也可以使用user
- gid 99 #进程的组ID,也可以使用group指定组名
- daemon #后台运行,等同于命令行参数-D
- #nbproc 2 多进程模式,默认只开启一个进程
- pidfile /var/run/haproxy/haproxy.pid
- #stats socket /var/run/haproxy/haproxy.sock level operator #能接收各种状态输出,以及能接收命令输入
- #debug
- #quiet
- defaults
- log global #使用global段的日志定义
- mode http #设置实例运行模式或协议,支持http、tcp和health,frontend和backend要一致
- option tcplog #启用记录tcp连接的日志,包含会话状态和时间,连接数,frontend、backend和server name,源地址和端口,当使用tcp模式时能找出客户端、服务器断开连接或超时。
- option dontlognull #不记录来自监控状态检查的空连接
- retries 3 #连接错误后,重传次数
- option redispatch #连接错误,启用会话重新分配
- maxconn 2000
- timeout connect 5000 #单位为毫秒,等待成功连接到服务器的最大时间值
- timeout client 50000 #设置在客户端侧的最大不活跃时间值,在TCP模式,最好跟服务器侧一致
- timeout server 50000 #设置在服务端侧的最大不活跃时间值,
- frontend pxc-front #描述允许客户端连接的监听套接字
- bind *:3306 #这个表示前端再连接3306端口时,haproxy把请求均匀分配给后端的三个数据库
- mode tcp
- default_backend pxc-back #当没有匹配use_backend时,默认的backend
- frontend pxc-onenode-front
- bind *:3308 #这个表示前端再连接haproxy的3308端口时,就表示haproxy只把请求分配各一个机器10.72.16.116,当116机器down了后,才会自动连接第二个数据库10.72.16.117
- mode tcp
- default_backend pxc-onenode-back
- frontend stats-front
- bind *:80
- mode http
- default_backend stats-back
- backend pxc-back #描述进来的连接将转发到哪些后端服务器
- mode tcp
- balance leastconn #负载均衡算法,使用最少连接算法,适合长连接应用
- option httpchk #启用HTTP协议检查服务器监控状态,通过调用脚本检查节点的状态
- server mariadb01 10.72.16.116:3306 check port 9200 inter 12000 rise 3 fall 3 #fall连续3次检查错误后,将表明服务器死亡,默认为3;inter连续两次检查的间隔时间值,单位为毫秒,默认为2s;rise连续3次检查成功,表明服务可用
- server mariadb02 10.72.16.117:3306 check port 9200 inter 12000 rise 3 fall 3
- server mariadb03 10.72.16.118:3307 check port 9200 inter 12000 rise 3 fall 3
- #option mysql-check user haproxy_check #使用Mysql健康检查,不检查数据库和数据一致性,需要在mysql上创建相应的检查帐户
- #server mariadb01 10.0.60.104:3306 check
- #server mariadb02 10.0.60.105:3306 check
- #server mariadb03 10.0.60.106:3306 check
- backend pxc-onenode-back
- mode tcp
- balance leastconn
- option httpchk
- server mariadb01 10.72.16.116:3306 check port 9200 inter 12000 rise 3 fall 3
- server mariadb02 10.72.16.117:3306 check port 9200 inter 12000 rise 3 fall 3 backup
- server mariadb03 10.72.16.118:3307 check port 9200 inter 12000 rise 3 fall 3 backup
- backend stats-back #开启haproxy的状态页面
- mode http
- balance roundrobin
- stats uri /haproxy/stats #定义访问统计信息的URI
- stats auth admin:admin #设置查看统计信息的用户名和密码
上面的配置中,如果想让pxc的三个机器都读写,并且负载均衡,可以让web连接haproxy的3306端口;如果怕pxc三个节点都写数据造成数据不一致,可以让web应用连接haproxy的3308端口,这样就只连接第一个机器,只有当第一个机器down了后,才会连接第二个或第三个。
当然,你也可以在程序上把读请求分配给haproxy的3306端口,这样就可以用haproxy的3306端口做读的负载均衡;而你让web的写请求连接haproxy的3308端口,这样web写机器只有一个。
十二、添加haproxy日志
vi /etc/rsyslog.conf
添加:
local0.* /var/log/haproxy.log #和haproxy的配置文件中定义的log level一致
修改vi /etc/rsyslog.conf
$ModLoad imudp #打开这个参数
$UDPServerRun 514 #打开这个参数
然后/etc/init.d/rsyslog restart
上面两个标黄色的参数很重要,必须打开,否则不转发。
十三、启动haproxy
service httpd stop //确保80端口没被占用
/usr/local/sbin/haproxy –f /usr/local/sbin/haproxy.cfg
停止服务:
#sudo killall haproxy
十四、在每个mysql集群节点安装mysql健康状态检查脚本
1、拷贝脚本,我rpm安装的pxc,发现不用拷贝,相应目录下自动就有这些脚本。
1 2 3 | cd /opt/PXC/ cp bin/clustercheck /usr/bin/ cp xinetd.d/mysqlchk /etc/xinetd.d/ |
2、添加服务端口:
echo 'mysqlchk 9200/tcp # mysqlchk' >> /etc/services
3、安装和启动xinetd服务
4、创建mysql的检查帐户,如不使用默认用户名和密码,将需要修改脚本/usr/bin/clustercheck
1 | grant process on *.* to 'clustercheckuser'@'localhost' identified by 'clustercheckpassword!'; |
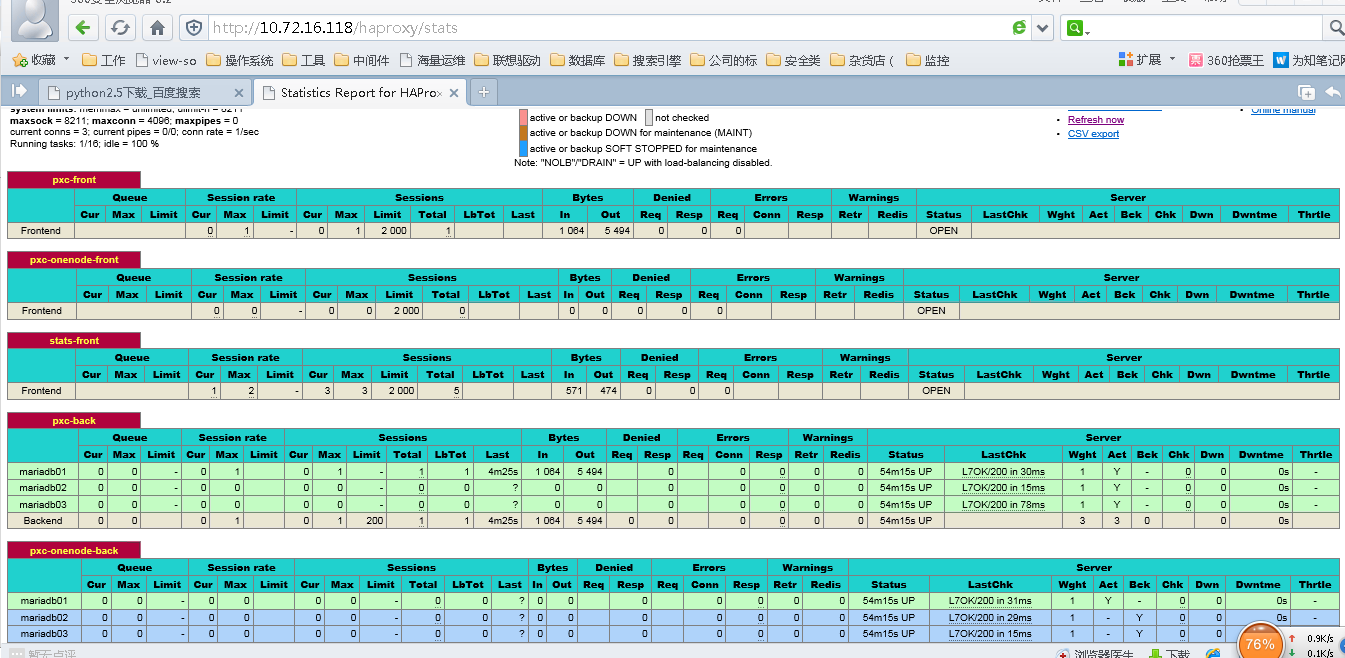
登录http://10.72.16.118/haproxy/stats,用户名和密码是admin和admin,如果能看到如下图,说明haproxy配置成功。
做完单节点的haproxy,你也可以用keepalved+haproxy防止haproxy单点故障,如果想用haproxy的话,请参考这个文档:http://www.cnblogs.com/taotaohappy/p/4694290.html
十五、测试
- [root@drbd-01 ~]# mysql -h10.72.16.118 -usysbench -psysbench -P3306
- Welcome to the MySQL monitor. Commands end with ; or \g.
- Your MySQL connection id is 17
- Server version: 5.5.41-37.0-55 Percona XtraDB Cluster (GPL), Release rel37.0, Revision 853, WSREP version 25.11, wsrep_25.11.r4027
- Copyright (c) 2009-2014 Percona LLC and/or its affiliates
- Copyright (c) 2000, 2014, Oracle and/or its affiliates. All rights reserved.
- Oracle is a registered trademark of Oracle Corporation and/or its
- affiliates. Other names may be trademarks of their respective
- owners.
- Type 'help;' or '\h' for help. Type '\c' to clear the current input statement.
- mysql> show variables like '%server_id%';
- +---------------+-------+
- | Variable_name | Value |
- +---------------+-------+
- | server_id | 116 |
- +---------------+-------+
- 1 row in set (0.01 sec)
- mysql> \q
- Bye
- [root@drbd-01 ~]# mysql -h10.72.16.118 -usysbench -psysbench -P3306
- Welcome to the MySQL monitor. Commands end with ; or \g.
- Your MySQL connection id is 25
- Server version: 5.5.41-37.0-55 Percona XtraDB Cluster (GPL), Release rel37.0, Revision 853, WSREP version 25.11, wsrep_25.11.r4027
- Copyright (c) 2009-2014 Percona LLC and/or its affiliates
- Copyright (c) 2000, 2014, Oracle and/or its affiliates. All rights reserved.
- Oracle is a registered trademark of Oracle Corporation and/or its
- affiliates. Other names may be trademarks of their respective
- owners.
- Type 'help;' or '\h' for help. Type '\c' to clear the current input statement.
- mysql> show variables like '%server_id%';
- +---------------+-------+
- | Variable_name | Value |
- +---------------+-------+
- | server_id | 117 |
- +---------------+-------+
- 1 row in set (0.00 sec)
- mysql> \q
- Bye
- [root@drbd-01 ~]# mysql -h10.72.16.118 -usysbench -psysbench -P3306
- Welcome to the MySQL monitor. Commands end with ; or \g.
- Your MySQL connection id is 955
- Server version: 5.5.41-37.0-55 Percona XtraDB Cluster (GPL), Release rel37.0, Revision 853, WSREP version 25.11, wsrep_25.11.r4027
- Copyright (c) 2009-2014 Percona LLC and/or its affiliates
- Copyright (c) 2000, 2014, Oracle and/or its affiliates. All rights reserved.
- Oracle is a registered trademark of Oracle Corporation and/or its
- affiliates. Other names may be trademarks of their respective
- owners.
- Type 'help;' or '\h' for help. Type '\c' to clear the current input statement.
- mysql> show variables like '%server_id%';
- +---------------+-------+
- | Variable_name | Value |
- +---------------+-------+
- | server_id | 118 |
- +---------------+-------+
- 1 row in set (0.00 sec)
1)下载sysbench
不知道为什么,我在sourceforge.net已经找不到该软件的下载地址了。就下载这个地址里面的吧:http://download.csdn.net/download/rcbblgy/7578433。(我的网盘工具里面有)
2) 安装sysbench
tar -xvf sysbench-0.5.tar.gz
cd sysbench-0.5
./autogen.sh
./configure --prefix=/usr/local/sysbench --with-mysql-includes=/usr/include/mysql --with-mysql-libs=/usr/lib64/mysql
make && make install
3)找台机器开始测试:
A、测试数据库oltp
准备数据prepare
/usr/local/sysbench/bin/sysbench --这样查看sysbench的帮助
- [root@dg soft]# /usr/local/sysbench/bin/sysbench --mysql-host=10.72.16.118 --mysql-port=3306 --mysql-user=sysbench --mysql-password=sysbench --mysql-db=test --oltp-tables-count=2 --oltp-table-size=60000 --num-threads=50 --max-requests=100000000 --report-interval=1 --max-time=20 --test=/rman_backup/soft/sysbench-0.5/sysbench/tests/db/oltp.lua prepare
- sysbench 0.5: multi-threaded system evaluation benchmark
- Creating table 'sbtest1'...
- Inserting 60000 records into 'sbtest1'
- Creating table 'sbtest2'...
- Inserting 60000 records into 'sbtest2'
进行测试及结果分析
oltp进行压测
- [root@dg soft]# /usr/local/sysbench/bin/sysbench --mysql-host=10.72.16.118 --mysql-port=3306 --mysql-user=sysbench --mysql-password=sysbench --mysql-db=test --oltp-tables-count=2 --oltp-table-size=60000 --num-threads=50 --max-requests=100000000 --report-interval=1 --max-time=20 --test=/rman_backup/soft/sysbench-0.5/sysbench/tests/db/oltp.lua run
- sysbench 0.5: multi-threaded system evaluation benchmark
- Running the test with following options:
- Number of threads: 50
- Report intermediate results every 1 second(s)
- Random number generator seed is 0 and will be ignored
- Threads started!
- [ 1s] threads: 50, tps: 34.97, reads/s: 1080.02, writes/s: 206.81
- [ 2s] threads: 50, tps: 93.01, reads/s: 1381.12, writes/s: 488.04
- [ 3s] threads: 50, tps: 97.02, reads/s: 1368.29, writes/s: 381.08
- [ 4s] threads: 50, tps: 139.02, reads/s: 1836.27, writes/s: 500.07
- [ 5s] threads: 50, tps: 210.03, reads/s: 2734.37, writes/s: 775.11
- [ 6s] threads: 50, tps: 66.51, reads/s: 1080.38, writes/s: 232.80
- [ 7s] threads: 50, tps: 40.95, reads/s: 354.58, writes/s: 160.81
- [ 8s] threads: 50, tps: 10.46, reads/s: 384.95, writes/s: 59.63
- [ 9s] threads: 50, tps: 46.78, reads/s: 598.16, writes/s: 164.22
- [ 10s] threads: 50, tps: 67.09, reads/s: 896.15, writes/s: 288.37
- [ 11s] threads: 50, tps: 41.53, reads/s: 597.66, writes/s: 165.12
- [ 12s] threads: 50, tps: 77.94, reads/s: 1049.16, writes/s: 332.73
- [ 13s] threads: 50, tps: 157.27, reads/s: 2096.08, writes/s: 610.70
- [ 14s] threads: 50, tps: 183.04, reads/s: 3074.35, writes/s: 932.72
- [ 15s] threads: 50, tps: 236.03, reads/s: 3175.41, writes/s: 876.11
- [ 16s] threads: 50, tps: 223.04, reads/s: 3082.61, writes/s: 869.17
- [ 17s] threads: 50, tps: 181.02, reads/s: 2475.33, writes/s: 722.10
- [ 18s] threads: 50, tps: 144.03, reads/s: 2002.35, writes/s: 565.10
- [ 19s] threads: 50, tps: 110.91, reads/s: 1810.47, writes/s: 521.56
- [ 20s] threads: 50, tps: 130.02, reads/s: 1765.27, writes/s: 458.07
- [ 21s] threads: 50, tps: 50.01, reads/s: 95.01, writes/s: 102.02
- OLTP test statistics:
- queries performed:
- read: 32886
- write: 9392
- other: 4691
- total: 46969
- transactions: 2342 (110.19 per sec.)
- deadlocks: 101 (4.75 per sec.)
- read/write requests: 42278 (1989.19 per sec.)
- other operations: 4691 (220.71 per sec.)
- Test execution summary:
- total time: 21.2539s
- total number of events: 2248
- total time taken by event execution: 1007.5943s
- per-request statistics:
- min: 69.23ms
- avg: 448.22ms
- max: 2327.38ms
- approx. 95 percentile: 1346.52ms
- Threads fairness:
- events (avg/stddev): 44.9600/8.23
- execution time (avg/stddev): 20.1519/0.34
分析压测结果 TPS是平均每秒钟事务提交次数,QPS表示每秒查询次数(包括read和write) oltp 读写比大概2000:600
可以对数据库进行调优后,再使用sysbench对OLTP进行测试,看看TPS是不是会有所提高。
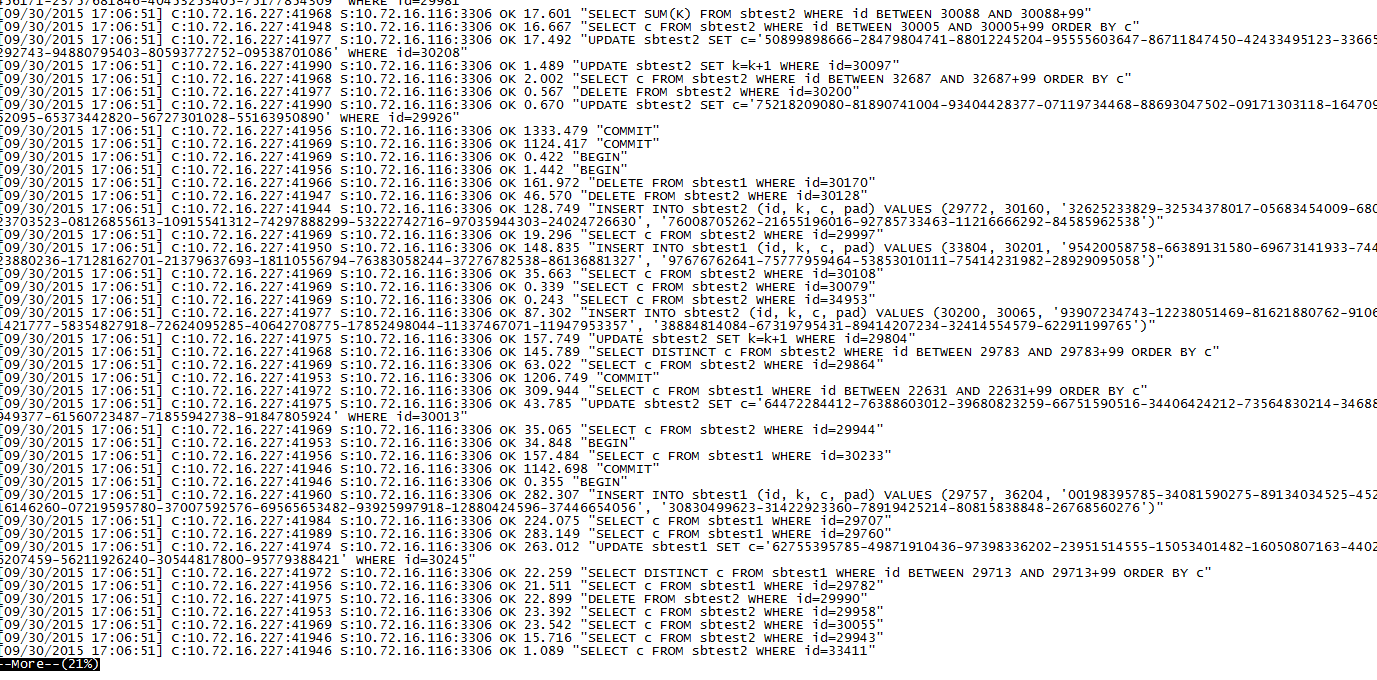
其实,执行上面的oltp.lua脚本,对数据库执行的是下面的sql语句,即有dml(insert、update、delete)语句,也 有select语句。
纯insert情况
- [root@dg soft]# /usr/local/sysbench/bin/sysbench --mysql-host=10.72.16.118 --mysql-port=3306 --mysql-user=sysbench --mysql-password=sysbench --mysql-db=test --oltp-tables-count=2 --oltp-table-size=60000 --num-threads=50 --max-requests=100000000 --report-interval=1 --max-time=20 --test=/rman_backup/soft/sysbench-0.5/sysbench/tests/db/insert.lua run
- sysbench 0.5: multi-threaded system evaluation benchmark
- Running the test with following options:
- Number of threads: 50
- Report intermediate results every 1 second(s)
- Random number generator seed is 0 and will be ignored
- Threads started!
- [ 1s] threads: 50, tps: 0.00, reads/s: 0.00, writes/s: 107.83
- [ 2s] threads: 50, tps: 0.00, reads/s: 0.00, writes/s: 10.99
- [ 3s] threads: 50, tps: 0.00, reads/s: 0.00, writes/s: 4.01
- [ 4s] threads: 50, tps: 0.00, reads/s: 0.00, writes/s: 204.03
- [ 5s] threads: 50, tps: 0.00, reads/s: 0.00, writes/s: 170.03
- [ 6s] threads: 50, tps: 0.00, reads/s: 0.00, writes/s: 50.01
- [ 7s] threads: 50, tps: 0.00, reads/s: 0.00, writes/s: 47.96
- [ 8s] threads: 50, tps: 0.00, reads/s: 0.00, writes/s: 78.02
- [ 9s] threads: 50, tps: 0.00, reads/s: 0.00, writes/s: 134.02
- [ 10s] threads: 50, tps: 0.00, reads/s: 0.00, writes/s: 108.02
- [ 11s] threads: 50, tps: 0.00, reads/s: 0.00, writes/s: 43.01
- [ 12s] threads: 50, tps: 0.00, reads/s: 0.00, writes/s: 196.46
- [ 13s] threads: 50, tps: 0.00, reads/s: 0.00, writes/s: 49.88
- [ 14s] threads: 50, tps: 0.00, reads/s: 0.00, writes/s: 38.29
- [ 15s] threads: 50, tps: 0.00, reads/s: 0.00, writes/s: 57.01
- [ 16s] threads: 50, tps: 0.00, reads/s: 0.00, writes/s: 41.01
- [ 17s] threads: 50, tps: 0.00, reads/s: 0.00, writes/s: 192.01
- [ 18s] threads: 50, tps: 0.00, reads/s: 0.00, writes/s: 170.04
- [ 19s] threads: 50, tps: 0.00, reads/s: 0.00, writes/s: 136.02
- [ 20s] threads: 50, tps: 0.00, reads/s: 0.00, writes/s: 86.93
- OLTP test statistics:
- queries performed:
- read: 0
- write: 1979
- other: 0
- total: 1979
- transactions: 0 (0.00 per sec.)
- deadlocks: 0 (0.00 per sec.)
- read/write requests: 1979 (96.34 per sec.)
- other operations: 0 (0.00 per sec.)
- Test execution summary:
- total time: 20.5416s
- total number of events: 1979
- total time taken by event execution: 1008.6923s
- per-request statistics:
- min: 6.64ms
- avg: 509.70ms
- max: 2380.45ms
- approx. 95 percentile: 1465.55ms
- Threads fairness:
- events (avg/stddev): 39.5800/2.64
- execution time (avg/stddev): 20.1738/0.21
创建初始化fileio文件:
- [root@dg soft]# /usr/local/sysbench/bin/sysbench --test=memory --memory-block-size=8192 --memory-total-size=10M run
- sysbench 0.5: multi-threaded system evaluation benchmark
- Running the test with following options:
- Number of threads: 1
- Random number generator seed is 0 and will be ignored
- Threads started!
- Operations performed: 1280 (351551.77 ops/sec)
- 10.00 MB transferred (2746.50 MB/sec)
- Test execution summary:
- total time: 0.0036s
- total number of events: 1280
- total time taken by event execution: 0.0026s
- per-request statistics:
- min: 0.00ms
- avg: 0.00ms
- max: 0.05ms
- approx. 95 percentile: 0.00ms
- Threads fairness:
- events (avg/stddev): 1280.0000/0.00
- execution time (avg/stddev): 0.0026/0.00
C、对磁盘io性能测试(fileio)
创建初始化fileio文件:
[root@dg soft]# /usr/local/sysbench/bin/sysbench --test=fileio --num-threads=16 --file-total-size=20M --file-test-mode=rndrw prepare[root@dg soft]# /usr/local/sysbench/bin/sysbench --test=fileio --num-threads=16 --file-total-size=20M --file-test-mode=rndrw runsysbench 0.5: multi-threaded system evaluation benchmarkRunning the test with following options:Number of threads: 16Random number generator seed is 0 and will be ignoredThreads started!Operations performed: 5997 reads, 4003 writes, 12800 Other = 22800 TotalRead 93.703Mb Written 62.547Mb Total transferred 156.25Mb (12.836Mb/sec)821.51 Requests/sec executedTest execution summary:total time: 12.1727stotal number of events: 10000total time taken by event execution: 11.9872sper-request statistics:min: 0.00msavg: 1.20msmax: 255.43msapprox. 95 percentile: 0.04msThreads fairness:events (avg/stddev): 625.0000/61.68execution time (avg/stddev): 0.7492/0.25
指定了最大创建16个线程,创建的文档总大小为20m,文档读写模式为随机读(rndrw),磁盘随机读写的速度大概为12M/s,随机读的iops的为821.51 Requests/sec。
D、CPU测试
- [root@dg soft]# /usr/local/sysbench/bin/sysbench --test=cpu --num-threads=32 --cpu-max-prime=90000 run
- sysbench 0.5: multi-threaded system evaluation benchmark
- Running the test with following options:
- Number of threads: 32
- Random number generator seed is 0 and will be ignored
- Primer numbers limit: 90000
- Threads started!
- Test execution summary:
- total time: 279.5934s
- total number of events: 10000
- total time taken by event execution: 8378.2930s
- per-request statistics:
- min: 26.75ms
- avg: 837.83ms
- max: 11742.00ms
- approx. 95 percentile: 3233.89ms
- Threads fairness:
- events (avg/stddev): 312.5000/35.70
- execution time (avg/stddev): 261.8217/16.40
32个线程,寻找90000以内的最大素数花了279s
E、测试完成执行cleanup
[root@dg soft]# /usr/local/sysbench/bin/sysbench --test=fileio --num-threads=16 --file-total-size=20M --file-test-mode=rndrw cleanup
参考文档:
http://itindex.net/detail/47688-percona-xtradb-cluster
http://wenku.baidu.com/link?url=GMpcb1yrTjM_oJyG3rQJFpFOhoc6-s4pacuuV1O1ofutJYfwdcP4Q9aUNRYeRRCvClt_4I_oLszQDcTyk9sY4bl7JyeG-9gaOJBiKUoB5K7
http://www.eduyo.com/computer/software/1086.html
http://my.oschina.net/anthonyyau/blog/277450
http://www.cnblogs.com/taotaohappy/p/4694290.html --请参考这个文档,很全,是keepalived+haproxy+pxc
http://itindex.net/detail/47702-percona-xtradb-cluster --pxc启动顺序。如果集群都关闭了,那么集群就都起不来了,因为一个节点启动前提是必须先有一个其他节点启动着,但关闭了哪来的存活节点,所以需要按照这个文档的方法来启动。
http://www.2cto.com/database/201412/362701.html --sysbench的使用和测试
http://www.2cto.com/database/201504/387166.html -- 实战体验几种MySQLCluster方案