本次我们主要一起学习两个小知识点
- Linux性能监控或者说是资源使用检查,重点熟悉 sar
- VI使用小技巧,它的功能强大到“令人发指”(褒义词),我们学习点常用的就好
-->> Linux性能分析
重点是sar,辅助其他工具

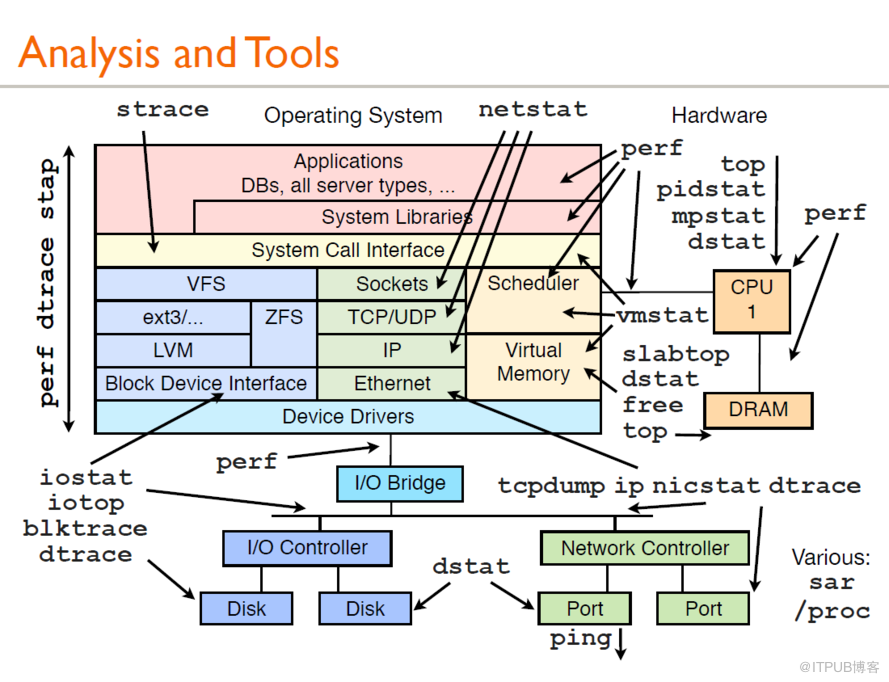
1、top
top是我们最常用的实时监控性能的工具(topas/glance)
基本用法如下:
[root@myasm ~]# top -help
top: procps version 3.2.8
usage: top -hv | -abcHimMsS -d delay -n iterations [-u user | -U user] -p pid [,pid ...]
举例:
top #系统运行多久,整体负载情况
[root@myasm ~]# top
top - 08:07:50 up 23 days, 15:40, 1 user, load average: 0.00, 0.00, 0.00
Tasks: 263 total, 2 running, 261 sleeping, 0 stopped, 0 zombie
Cpu(s): 0.2%us, 0.3%sy, 0.0%ni, 99.6%id, 0.0%wa, 0.0%hi, 0.0%si, 0.0%st
Mem: 4041252k total, 3139868k used, 901384k free, 439188k buffers
Swap: 4972540k total, 0k used, 4972540k free, 1966860k cached
2、sar
sar(System Activity Reporter系统活动情况报告)
是目前LINUX上最为全面的系统性能分析工具之一,
可以从多方面对系统的活动进行报告,包括:文件的读写情况、系统调用的使用情况、磁盘I/O、CPU效率、内存使用状况、进程活动及IPC有关的活动等方面。

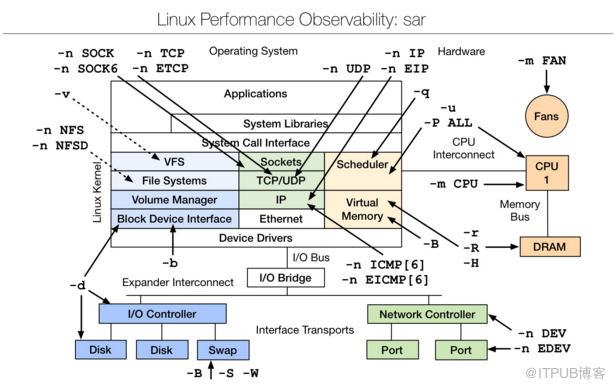
SAR 常用命令如下:
[root@myasm ~]# sar -help
Usage: sar [ options ] [ [ ] ]
Options are:
[ -A ] [ -b ] [ -B ] [ -C ] [ -d ] [ -h ] [ -m ] [ -p ] [ -q ] [ -r ] [ -R ]
[ -S ] [ -t ] [ -u [ ALL ] ] [ -v ] [ -V ] [ -w ] [ -W ] [ -y ]
[ -I { [,...] | SUM | ALL | XALL } ] [ -P { [,...] | ALL } ]
[ -j { ID | LABEL | PATH | UUID | ... } ] [ -n { [,...] | ALL } ]
[ -o [ ] | -f [ ] ] [ --legacy ]
[ -i ] [ -s [ ] ] [ -e [ ] ]
#### 更多详细说明,找那个男人(
man
)
部分输出项解释:
举例:
##磁盘,每1秒收集一次,一共执行10次,如果配置多路径负载均衡,可以确认是否使用。
sar -dp 1 10 #p参数是为了优化输出
11:34:30 AM DEV tps rd_sec/s wr_sec/s avgrq-sz avgqu-sz await svctm %util
11:34:31 AM sda 0.00 0.00 0.00 0.00 0.00 0.00 0.00 0.00
11:34:31 AM sdb 0.00 0.00 0.00 0.00 0.00 0.00 0.00 0.00
11:34:31 AM sdh 0.00 0.00 0.00 0.00 0.00 0.00 0.00 0.00
11:34:31 AM sdc 0.00 0.00 0.00 0.00 0.00 0.00 0.00 0.00
11:34:31 AM sdf 0.00 0.00 0.00 0.00 0.00 0.00 0.00 0.00
11:34:31 AM sdd 0.00 0.00 0.00 0.00 0.00 0.00 0.00 0.00
11:34:31 AM sde 0.00 0.00 0.00 0.00 0.00 0.00 0.00 0.00
11:34:31 AM sdg 0.00 0.00 0.00 0.00 0.00 0.00 0.00 0.00
部分输出项解释:
举例:
##cup
sar -u 1 2
Linux 2.6.32-573.el6.x86_64 (myasm) 02/07/2020 _x86_64_ (4 CPU)
11:56:56 AM CPU %user %nice %system %iowait %steal %idle
11:56:57 AM all 0.00 0.00 1.02 0.00 0.00 98.98
11:56:58 AM all 0.25 0.00 1.02 0.00 0.00 98.73
Average: all 0.13 0.00 1.02 0.00 0.00 98.85
部分输出项解释:
举例:
#内存 ,可以结合free 命令查看
sar -r 1 2
12:17:01 PM kbmemfree kbmemused %memused kbbuffers kbcached kbcommit %commit
12:17:02 PM 907508 3133744 77.54 436948 1966408 2299724 25.51
12:17:03 PM 907508 3133744 77.54 436948 1966408 2299724 25.51
Average: 907508 3133744 77.54 436948 1966408 2299724 25.51
部分输出项解释:
举例:
#网络
sar -n DEV 1 2 |egrep 'eth0|IFACE' #显示网卡eth0
02:53:34 PM IFACE rxpck/s txpck/s rxkB/s txkB/s rxcmp/s txcmp/s rxmcst/s
02:53:35 PM eth0 4.04 0.00 0.27 0.00 0.00 0.00 0.00
02:53:35 PM IFACE rxpck/s txpck/s rxkB/s txkB/s rxcmp/s txcmp/s rxmcst/s
02:53:36 PM eth0 4.04 1.01 0.24 0.29 0.00 0.00 0.00
Average: IFACE rxpck/s txpck/s rxkB/s txkB/s rxcmp/s txcmp/s rxmcst/s
Average: eth0 4.04 0.51 0.26 0.15 0.00 0.00 0.00
部分输出项解释:
举例:
#I/O和传送速率的统计信息
sar -b 1 2
Linux 2.6.32-573.el6.x86_64 (myasm) 02/07/2020 _x86_64_ (4 CPU)
02:55:20 PM tps rtps wtps bread/s bwrtn/s
02:55:21 PM 16.49 4.12 12.37 131.96 164.95
02:55:22 PM 2.04 0.00 2.04 0.00 16.33
Average: 9.23 2.05 7.18 65.64 90.26
部分输出项解释:
##>>制作图表
#输出到二进制文件
sar -o sarfile.log -dp 1 10
##制作成csv格式
sadf -d sarfile.log | sed 's/;/,/g' > sarfile.csv
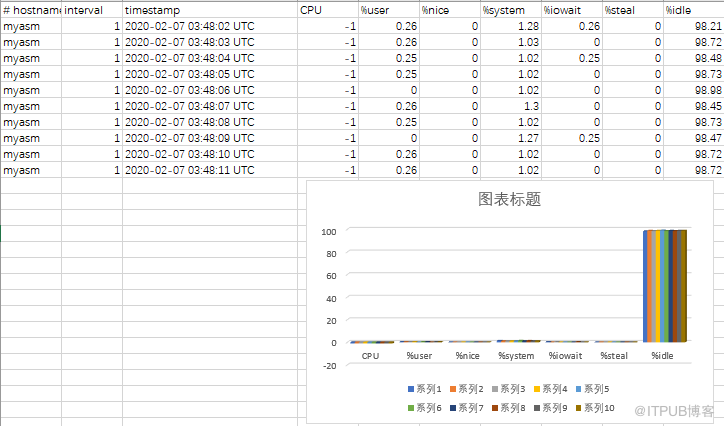
例子:

3、iostat
iostat 用于输出CPU和磁盘I/O相关的统计信息。
[root@myasm mytest]# iostat -help
Usage: iostat [ options ] [ [ ] ]
Options are:
[ -c ] [ -d ] [ -N ] [ -n ] [ -h ] [ -k | -m ] [ -t ] [ -V ] [ -x ] [ -y ] [ -z ]
[ -j { ID | LABEL | PATH | UUID | ... } [ [...] | ALL ] ]
[ [...] | ALL ] [ -p [ [,...] | ALL ] ]
举例:
iostat 1 2 # 设备扩展向 iostat -x 1 2
Linux 2.6.32-573.el6.x86_64 (myasm) 02/08/2020 _x86_64_ (4 CPU)
avg-cpu: %user %nice %system %iowait %steal %idle
0.18 0.00 0.20 0.06 0.00 99.56
Device: tps Blk_read/s Blk_wrtn/s Blk_read Blk_wrtn
sda 0.20 0.35 2.23 715330 4558778
sdb 0.05 0.23 0.48 470018 975568
sdh 0.33 7.84 6.98 16014900 14244713
sdc 0.33 0.00 2.66 8820 5438344
sdf 0.43 0.24 5.25 500050 10718248
sdd 0.00 0.00 0.00 4922 80
sde 0.00 0.00 0.00 2520 0
sdg 1.61 27.44 19.89 56035885 40610996
dm-0 0.29 0.35 2.23 705530 4558728
dm-1 0.00 0.00 0.00 2744 0
dm-2 0.66 0.24 5.25 498826 10718248
dm-3 0.00 0.00 0.00 3698 80
dm-4 0.07 0.23 0.48 468794 975568
avg-cpu 部分输出项说明:
Device 部分基本输出项说明:
Device 部分扩展输出项说明(iostat -x ):
4、mpstat
mpstat 输出每一个 CPU 的运行状况,为多处理器系统中的 CPU 利用率提供统计信息。
[root@myasm ~]# mpstat -help
Usage: mpstat [ options ] [ [ ] ]
Options are:
[ -A ] [ -I { SUM | CPU | ALL } ] [ -u ]
[ -P { [,...] | ON | ALL } ] [ -V ]
举例:
mpstat 1 2 # 命令输出不展示,类似sar -u
mpstat -P ALL 1 2 #cpu ALL/也可选择第几个cpu(-P 2 1 2) 1秒收集一次,共计两次
07:53:30 AM CPU %usr %nice %sys %iowait %irq %soft %steal %guest %idle
07:53:31 AM all 0.00 0.00 0.26 0.26 0.00 0.00 0.00 0.00 99.49
07:53:31 AM 0 0.00 0.00 0.00 0.00 0.00 0.00 0.00 0.00 100.00
07:53:31 AM 1 0.00 0.00 0.00 0.00 0.00 0.00 0.00 0.00 100.00
07:53:31 AM 2 1.00 0.00 0.00 0.00 0.00 0.00 0.00 0.00 99.00
07:53:31 AM 3 0.00 0.00 0.00 0.00 0.00 0.00 0.00 0.00 100.00
部分输出项解释:
5、vmstat
vmstat命令是最常见的Linux/Unix监控工具,属于sysstat包。可以展现给定时间间隔的服务器的状态值,包括服务器的CPU使用率,内存使用,虚拟内存交换情况,IO读写情况。
[root@myasm ~]# vmstat -help
usage: vmstat [-V] [-n] [delay [count]]
-V prints version.
-n causes the headers not to be reprinted regularly.
-a print inactive/active page stats.
-d prints disk statistics
-D prints disk table
-p prints disk partition statistics
-s prints vm table
-m prints slabinfo
-t add timestamp to output
-S unit size
delay is the delay between updates in seconds.
unit size k:1000 K:1024 m:1000000 M:1048576 (default is K)
count is the number of updates.
举例:
vmstat 1 2 #使用详情及具体解释可 man vmstat
procs -----------memory---------- ---swap-- -----io---- --system-- -----cpu-----
r b swpd free buff cache si so bi bo in cs us sy id wa st
0 0 0 904704 439200 1966928 0 0 5 5 4 3 0 0 100 0 0
1 0 0 904500 439200 1966928 0 0 0 0 1586 3129 0 0 100 0 0
6、iotop
iotop 默认是不安装的,如果需要,需手动安装。 安装命令
yum -y install iotop。
如果没有系统盘怎么办,iotop包下载地址:
https://pkgs.org/download/iotop
解释:iotop是一款开源、免费的用来监控磁盘I/O使用状况的类似top命令的工具,iotop可以监控进程的I/O信息。它是Python语言编写的,与iostat工具比较,iostat是系统级别的IO监控,而iotop是进程级别IO监控。
[root@myasm ~]# iotop -help
Usage: /usr/sbin/iotop [OPTIONS]
DISK READ and DISK WRITE are the block I/O bandwidth used during the sampling
period. SWAPIN and IO are the percentages of time the thread spent respectively
while swapping in and waiting on I/O more generally. PRIO is the I/O priority at
which the thread is running (set using the ionice command).
Controls: left and right arrows to change the sorting column, r to invert the
sorting order, o to toggle the --only option, p to toggle the --processes
option, a to toggle the --accumulated option, q to quit, any other key to force
a refresh.
Options:
--version show program's version number and exit
-h, --help show this help message and exit
-o, --only only show processes or threads actually doing I/O
-b, --batch non-interactive mode
-n NUM, --iter=NUM number of iterations before ending [infinite]
-d SEC, --delay=SEC delay between iterations [1 second]
-p PID, --pid=PID processes/threads to monitor [all]
-u USER, --user=USER users to monitor [all]
-P, --processes only show processes, not all threads
-a, --accumulated show accumulated I/O instead of bandwidth
-k, --kilobytes use kilobytes instead of a human friendly unit
-t, --time add a timestamp on each line (implies --batch)
-q, --quiet suppress some lines of header (implies --batch)
举例:
#只显示正在产生io的进程或线程
iotop -o
#非交互模式,5秒执行一次,执行10次,输出到日志。如果打算输出日志,建议非交互模式
nohup iotop -b -o -n 10 -d 5 -t > /tmp/iotop.log &
7、其他工具,例如 osw,dd磁盘测速、netstat网络信息等
其他工具不做介绍,大家有兴趣的可以去测试下。
-->> VI使用小技巧
- Green = Essential
- Yellow = Basic
- Orange / Blue = Advanced
- Red = Expert

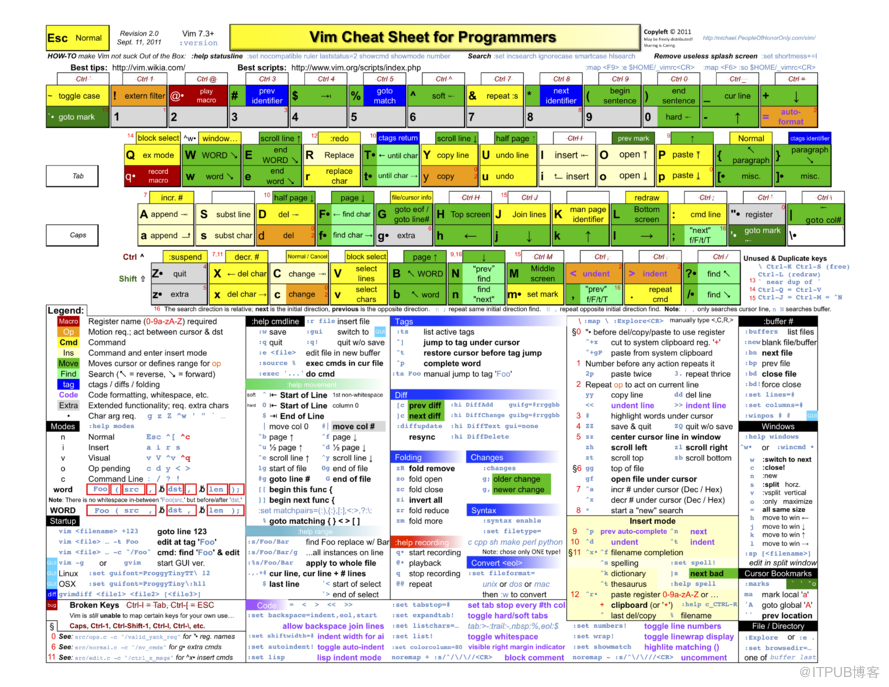
一些简单的命令就不说了,例如 i-->插入,上下左右键的使用(有时候还不管用)。
小知识:在unix系统,尤其hpux中,有时候回格键会各种乱码影响编写命令,可使用一下环境变量
#就进入vi的编辑模式了,回格键好用,还能使用vi 的一些小技巧
set -o vi
#而且命令还能上下翻,Ctrl+k/j/h/l 意思 上下左右,当然也能编辑
#注意,linux中,如果使用 是Esc+k/j/h/l
以下命令都是命令行模式下,也就是没按"i"
注意:vim是vi的升级版,有些命令vi无法操作,如果打算使用更高级的方法,推荐使用vim
分享到此结束,谢谢。
如有其它问题,我们可以继续探讨。